Understanding The Psychrometric Chart

The psychrometric chart is a tool commonly used in the field of engineering to understand and analyze the properties of air. This chart provides valuable information about the thermodynamic properties of moist air, which is crucial for various applications such as heating, ventilation, and air conditioning (HVAC) systems. By understanding the psychrometric chart, engineers can make more informed decisions and optimize their designs for enhanced efficiency and comfort.
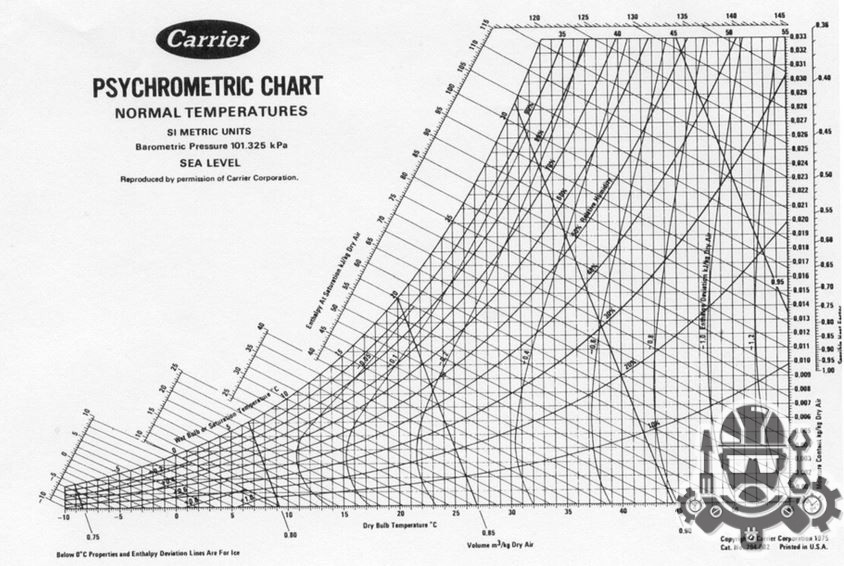
The psychrometric chart consists of several components that enable engineers to accurately interpret and analyze the properties of air. One important component is the dry bulb temperature, which represents the actual air temperature measured with a regular thermometer. Another key component is the wet bulb temperature, which is the lowest temperature that can be reached by evaporating water into the air. The difference between the dry and wet bulb temperatures is known as the wet bulb depression and is used to determine the humidity of the air.

In addition to temperature, the psychrometric chart also includes other properties such as humidity ratio, enthalpy, and specific volume. The humidity ratio represents the mass of moisture present in the air per unit mass of dry air, while enthalpy is the total heat content of the air including both sensible and latent heat. Specific volume, on the other hand, is the volume occupied by a unit mass of air. Together, these properties provide a comprehensive understanding of the thermodynamic behavior of moist air.
- Benefits of Using the Psychrometric Chart in Engineering:
| Enhanced HVAC Design | Improved Energy Efficiency | Precise Moisture Control |
|---|---|---|
| By utilizing the psychrometric chart, engineers can optimize the design of HVAC systems and ensure proper air conditioning and ventilation. This leads to improved comfort and indoor air quality for occupants. | Understanding the psychrometric properties of air allows engineers to fine-tune their designs for enhanced energy efficiency. By utilizing the chart, engineers can identify the most efficient temperature and humidity conditions for cooling and dehumidification processes. | The psychrometric chart enables engineers to accurately control the moisture levels in a space. This is crucial for applications that require precise moisture control, such as laboratories, manufacturing facilities, and cleanrooms. |
Overall, understanding the psychrometric chart is essential for engineers involved in HVAC design and other air-related applications. It provides valuable insights into the properties of moist air, enabling engineers to make informed decisions and optimize their designs for enhanced efficiency and comfort. By analyzing the various components and properties of the chart, engineers can ensure precise moisture control, improved energy efficiency, and enhanced HVAC design.
Contents
Components Of The Psychrometric Chart
The psychrometric chart is an essential tool used in the field of HVAC design and engineering to analyze and understand the properties of air. It provides a graphical representation of the thermodynamic properties of air, such as temperature, humidity, and enthalpy, and enables HVAC professionals to accurately design and evaluate air conditioning systems. To fully grasp the significance and functionality of the psychrometric chart, it is important to understand its components and how they contribute to the overall understanding of air properties.
There are several key components of the psychrometric chart that play a crucial role in analyzing and interpreting air properties. These components include dry-bulb temperature, wet-bulb temperature, relative humidity, enthalpy, specific volume, and dew point temperature. Each of these properties provides important information about the moisture content and energy characteristics of air, and their interactions form the basis of psychrometric analysis.
The dry-bulb temperature is the temperature of the air measured by a regular thermometer and is represented along the horizontal axis of the psychrometric chart. It is a fundamental property used to determine the state of air and its heating or cooling requirements. The wet-bulb temperature, on the other hand, is the lowest temperature that can be achieved by evaporative cooling of a water-saturated wick wrapped around a thermometer. It represents the cooling capacity and moisture content of air and is shown as diagonal lines on the psychrometric chart.
| Component | Description |
|---|---|
| Relative Humidity | The relative humidity is the ratio of the actual amount of water vapor in the air to the maximum amount of water vapor the air can hold at that specific temperature. It is expressed as a percentage and provides a measure of how close the air is to saturation. |
| Enthalpy | Enthalpy is the total heat content of the air and is represented by the vertical axis on the psychrometric chart. It includes both sensible heat (temperature-related) and latent heat (moisture-related). Enthalpy values allow HVAC designers to evaluate the heat transfer requirements of air and to determine the energy efficiency of systems. |
| Specific Volume | Specific volume is the volume occupied by a unit mass of air at a given temperature and pressure. It is an important property used to calculate airflows in HVAC systems and is represented by the curved lines on the psychrometric chart. |
| Dew Point Temperature | The dew point temperature is the temperature at which moisture in the air begins to condense. It indicates the point at which air becomes saturated and is an important parameter for evaluating the potential for mold growth or condensation in HVAC systems. |
Understanding and analyzing the components of the psychrometric chart is crucial for HVAC professionals to design and evaluate air conditioning systems effectively. By utilizing this powerful tool, engineers and designers can make informed decisions about the selection of equipment, duct sizing, and energy efficiency optimization. Moreover, the psychrometric chart enables a comprehensive understanding of air properties, facilitating proper system operation and maintenance for optimal indoor comfort and air quality.
Interpreting Psychrometric Properties
The psychrometric chart is a useful tool in the field of HVAC design and engineering. It helps in understanding and interpreting various properties of air, such as temperature, humidity, and dew point. By analyzing these properties, engineers can make informed decisions regarding the design and operation of HVAC systems. In this blog post, we will delve into the topic of interpreting psychrometric properties and how it can benefit engineers in their work.
One of the key properties depicted on the psychrometric chart is the dry bulb temperature. This represents the actual temperature of the air, measured using a regular thermometer. It is denoted by a horizontal line on the chart. The wet bulb temperature, on the other hand, represents the lowest temperature that can be achieved by evaporative cooling. It is measured using a thermometer with a wetted wick and is shown as a curved line on the chart.
Another important property on the psychrometric chart is relative humidity. It is defined as the ratio of the actual amount of moisture present in the air to the maximum amount of moisture it can hold at a given temperature. Relative humidity is represented by diagonal lines on the chart. By reading the values at the intersection of dry bulb temperature and relative humidity lines, engineers can determine the moisture content of the air.
- There are also specific terms that are used to describe the condition of the air on the psychrometric chart. When the dry bulb temperature and the wet bulb temperature are the same, it indicates that the air is fully saturated with moisture and is at the dew point temperature. If the lines representing the dry and wet bulb temperatures on the chart are far apart, it suggests a low humidity condition. On the other hand, if the lines are close to each other, it indicates a high humidity condition.
-
Property Symbol Dry Bulb Temperature T Wet Bulb Temperature Tw Relative Humidity RH
In conclusion, interpreting psychrometric properties is essential for engineers in the HVAC industry. By analyzing the dry bulb temperature, wet bulb temperature, relative humidity, and understanding the relationship between them on the psychrometric chart, engineers can make informed decisions regarding the design, operation, and maintenance of HVAC systems. This helps in ensuring optimal air quality, comfort, and energy efficiency in various indoor environments.
Using The Psychrometric Chart For Hvac Design

The psychrometric chart is an essential tool for HVAC (Heating, Ventilation, and Air Conditioning) design. It allows engineers and designers to understand the properties of air and its behavior in various conditions. By utilizing the psychrometric chart, they can effectively analyze and optimize the performance of HVAC systems, ensuring comfort, energy efficiency, and indoor air quality.
The psychrometric chart consists of several components that help in interpreting the properties of air. These components include dry-bulb temperature, relative humidity, humidity ratio, dew point temperature, and enthalpy. Each of these properties plays a crucial role in HVAC design as they impact the selection of equipment, control strategies, and overall system performance.
One of the primary applications of the psychrometric chart in HVAC design is determining the required cooling and heating loads. By plotting the indoor and outdoor air conditions on the chart, engineers can identify the exact amount of cooling or heating needed to maintain a comfortable indoor environment. This information is crucial for selecting appropriate HVAC equipment, such as air conditioners, heat pumps, or furnaces, and sizing them correctly.
- Making accurate predictions about the behavior of air is vital for successful HVAC design. Throughout the design process, engineers must consider factors such as outdoor weather conditions, building insulation, ventilation rates, and desired indoor comfort levels. By utilizing the psychrometric chart, they can visualize and analyze the effects of these factors on the properties of air, helping them make informed decisions and achieve optimal system design.
| Benefits of Using the Psychrometric Chart in Engineering: |
|---|
| 1. Enhanced Energy Efficiency: By understanding the psychrometric properties of air, engineers can design HVAC systems that maximize energy efficiency. They can optimize the air distribution, adjust temperature and humidity levels, and employ strategies like heat recovery to reduce energy consumption. |
| 2. Improved Indoor Air Quality: Proper HVAC design ensures a healthy and comfortable indoor environment. By analyzing the psychrometric properties, engineers can control humidity levels, prevent condensation and mold growth, and provide adequate ventilation, contributing to better indoor air quality. |
| 3. Accurate System Sizing: The psychrometric chart aids in accurately sizing HVAC equipment. Engineers can precisely determine the cooling and heating loads based on the specific air conditions, reducing oversizing or undersizing issues. This leads to cost savings, improved system performance, and extended equipment lifespan. |
| 4. Optimal Control Strategies: By utilizing the psychrometric chart, engineers can develop effective control strategies for HVAC systems. They can adjust temperature and humidity levels based on user requirements, occupant density, and outdoor conditions, ensuring optimal comfort and energy efficiency. |
In conclusion, the psychrometric chart is an invaluable tool for HVAC design. Its ability to illustrate the complex relationships between air properties enables engineers to make informed decisions, optimize system performance, and provide comfortable and healthy indoor environments. By utilizing the psychrometric chart, engineers can enhance energy efficiency, improve indoor air quality, accurately size HVAC equipment, and develop optimal control strategies. Thus, the psychrometric chart serves as a fundamental resource for efficient and effective HVAC design.
Benefits Of Using The Psychrometric Chart In Engineering
The psychrometric chart is a useful tool in the field of engineering, offering various benefits for professionals in this industry. By understanding and utilizing this chart, engineers can improve their HVAC designs, make more accurate interpretations of psychrometric properties, and ultimately enhance their overall engineering processes. In this blog post, we will explore some of the key benefits of using the psychrometric chart in engineering.
One major advantage of using the psychrometric chart in engineering is its ability to assist in HVAC design. HVAC systems are crucial in controlling temperature, humidity, and ventilation in various spaces such as buildings, factories, and vehicles. The psychrometric chart provides engineers with a graphical representation of the relationship between temperature, humidity, and other psychrometric properties. By referring to the chart, engineers can easily determine the air conditions needed for specific spaces and select the appropriate HVAC system accordingly. This helps in optimizing energy efficiency and ensuring comfort for occupants.
Additionally, the psychrometric chart aids engineers in interpreting psychrometric properties. These properties include dry bulb temperature, wet bulb temperature, relative humidity, and dew point temperature, among others. The chart visually displays the relationship between these properties, allowing engineers to analyze and understand them more effectively. By recognizing these properties and their interplay, engineers can make informed decisions regarding system design, equipment selection, and troubleshooting. This enhances the accuracy and efficiency of their engineering processes.
| Benefits of Using the Psychrometric Chart in Engineering: |
|---|
| 1. Enhanced HVAC Design: The psychrometric chart assists engineers in designing HVAC systems that optimize energy efficiency and ensure occupant comfort. |
| 2. Improved Interpretation of Psychrometric Properties: By referring to the chart, engineers can better understand and analyze various psychrometric properties crucial for system design, equipment selection, and troubleshooting. |
| 3. Enhanced Accuracy and Efficiency: Utilizing the psychrometric chart allows engineers to make more accurate decisions, resulting in efficient engineering processes and better overall outcomes. |
In conclusion, the psychrometric chart offers numerous benefits for engineers in the field of engineering. By utilizing this tool, professionals can enhance their HVAC designs, interpret psychrometric properties more effectively, and ultimately improve the accuracy and efficiency of their engineering processes. The psychrometric chart is an invaluable asset in the world of engineering, empowering professionals to optimize energy usage, create comfortable environments, and achieve successful engineering outcomes.
A psychrometric chart is a graphical representation of the thermodynamic properties of moist air. It is used to analyze and interpret the various properties of air, such as temperature, humidity, and enthalpy, in HVAC design and engineering.
A psychrometric chart typically includes axes for dry-bulb temperature, humidity ratio, relative humidity, enthalpy, and specific volume. It also includes various lines and curves that represent specific air properties, such as the saturation line, wet-bulb temperature line, and dew point line.
To interpret the psychrometric properties on a chart, you can locate a specific point on the chart that represents the air conditions you are interested in, such as a dry-bulb temperature of 25°C and a relative humidity of 50%. From this point, you can read off other properties such as the humidity ratio, enthalpy, and specific volume.
In HVAC design, the psychrometric chart helps engineers analyze the thermal comfort, moisture control, and energy efficiency of a building. It is used to determine the optimal air conditioning and heating requirements, select appropriate equipment, and design effective ventilation systems.
Using the psychrometric chart in engineering allows for a better understanding of the properties and behavior of air, leading to more accurate and efficient HVAC system design. It helps engineers analyze and optimize air-conditioning processes, predict condensation and moisture problems, and ensure indoor air quality and thermal comfort.
The psychrometric chart can be used in HVAC troubleshooting to diagnose and identify problems related to humidity control, such as inadequate dehumidification or excessive moisture. By analyzing the air properties and comparing them to the desired conditions, engineers can pinpoint issues and make necessary adjustments to the system.
Yes, the psychrometric chart has applications beyond HVAC design. It is also used in fields such as industrial processes, agriculture, and meteorology. For example, it can be used to analyze the drying of agricultural products, or to study the behavior of air masses in weather forecasting.


